
Overview
The Overview dashboard gives you a consolidated view of your AIsa workspace. It shows your available balance, API activity, resource consumption, and model usage in real time, allowing you to quickly assess whether your integration is working as expected and how your usage is evolving.
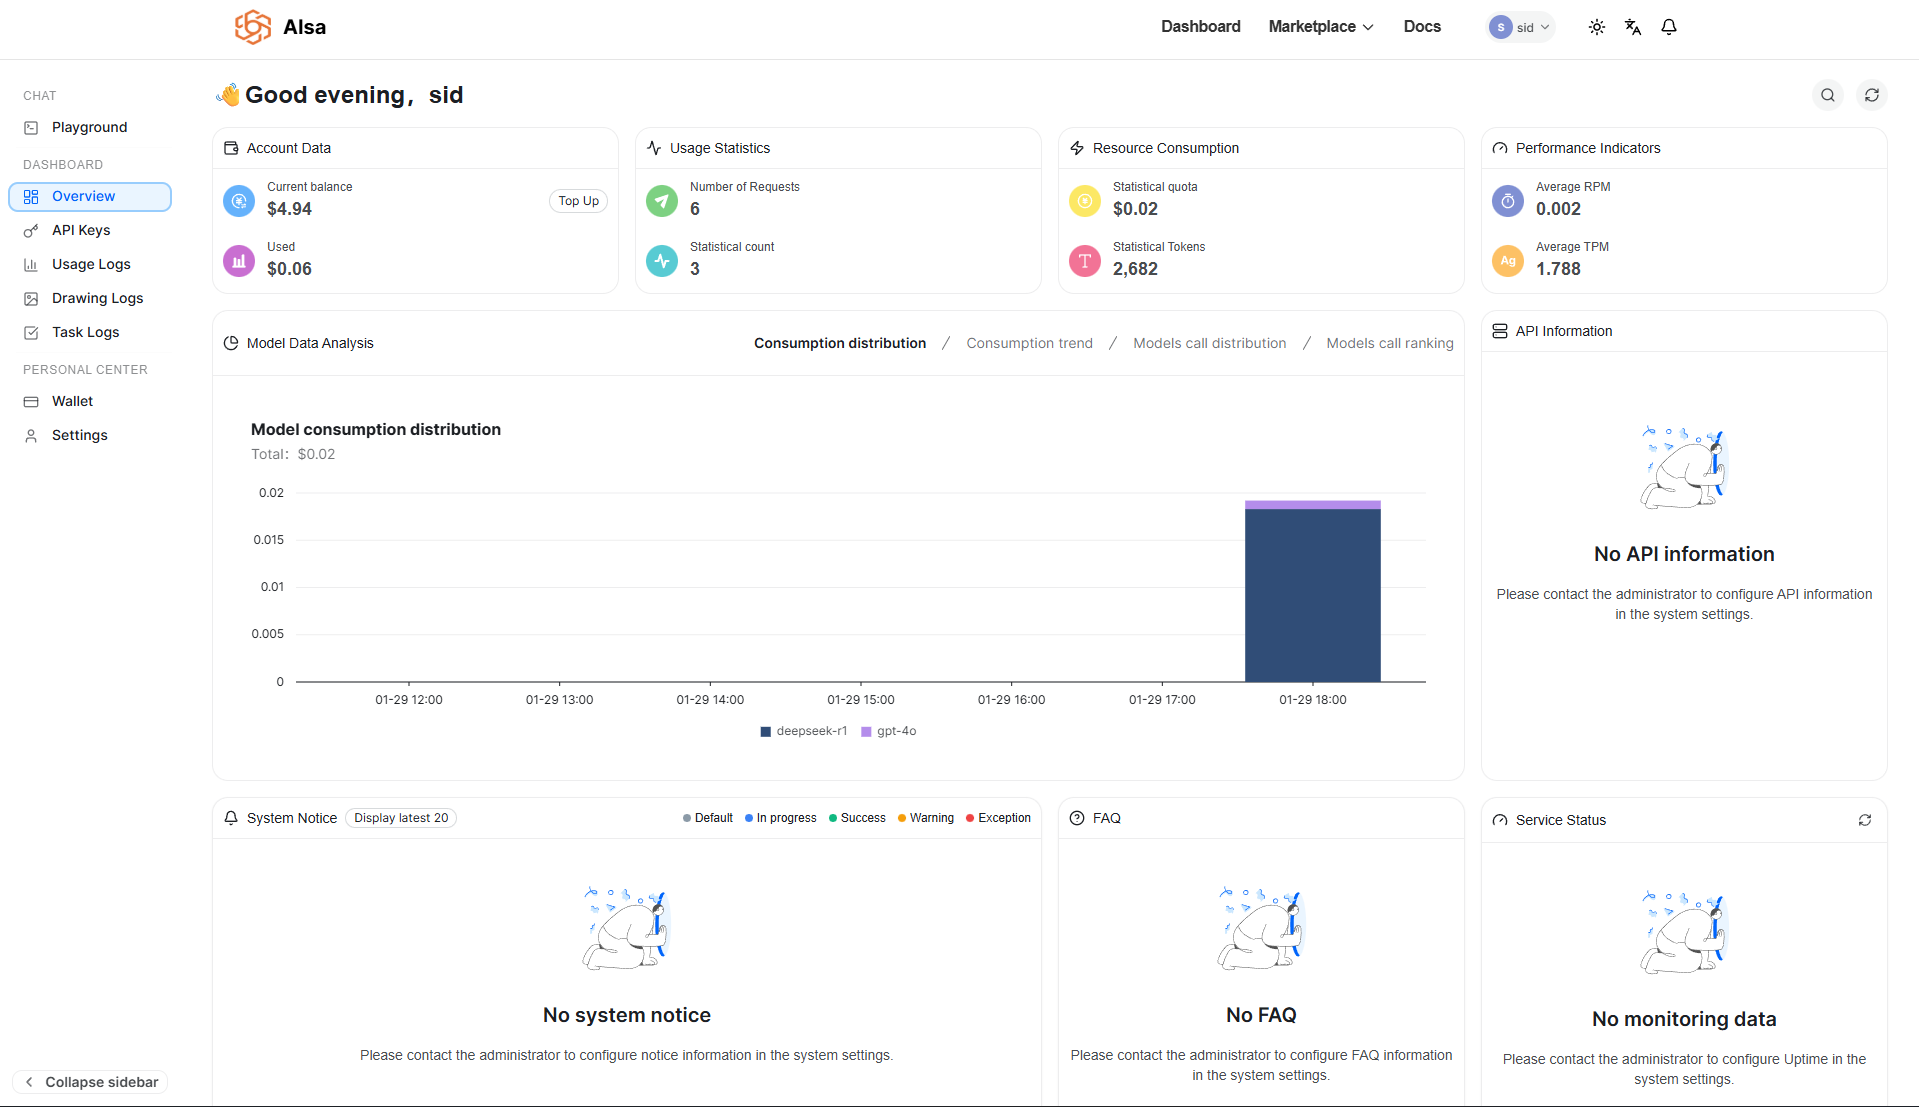
This page is typically the first place to check after setting up an API key, sending test requests, or monitoring ongoing usage in production.
Account Data
The Account Data section reflects the current financial state of your account.
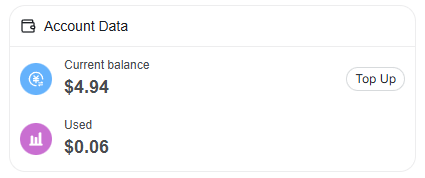
Current Balance shows the amount of credit available for API usage. New accounts start with $5.00 in free credits, which are deducted automatically as requests are processed.
Used represents the total amount consumed so far across all API calls.
If your balance runs low, you can add credits using the Top Up action. All values update automatically as usage occurs.
Usage Statistics
Usage Statistics provide a quick confirmation that requests are reaching AIsa.
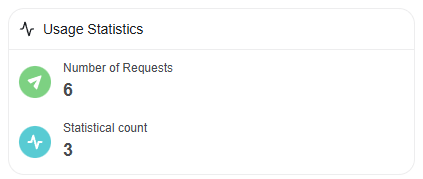
Number of Requests shows how many API calls have been received within the selected time window.
Statistical Count is an internal aggregation metric used for usage tracking and reporting.
Together, these indicators help you verify activity before inspecting detailed request logs.
Resource Consumption
The Resource Consumption panel tracks how much of your account quota is being used.
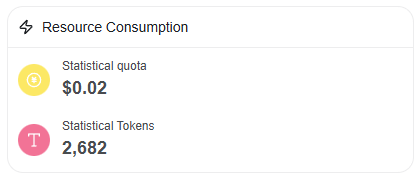
Statistical Quota represents total usage in monetary terms.
Statistical Tokens shows the total number of tokens processed across all requests.
When no traffic has been generated, these values remain at zero. As usage grows, this section becomes the primary reference for cost visibility.
Performance Indicators
Performance Indicators describe how your requests are being processed over time.
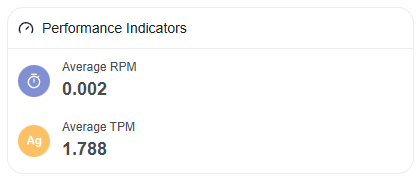
Average RPM (Requests Per Minute) shows the average request throughput.
Average TPM (Tokens Per Minute) shows the average token processing rate.
These metrics are useful for understanding traffic patterns and identifying spikes or sustained load.
Model Data Analysis
Model Data Analysis breaks down usage by model.
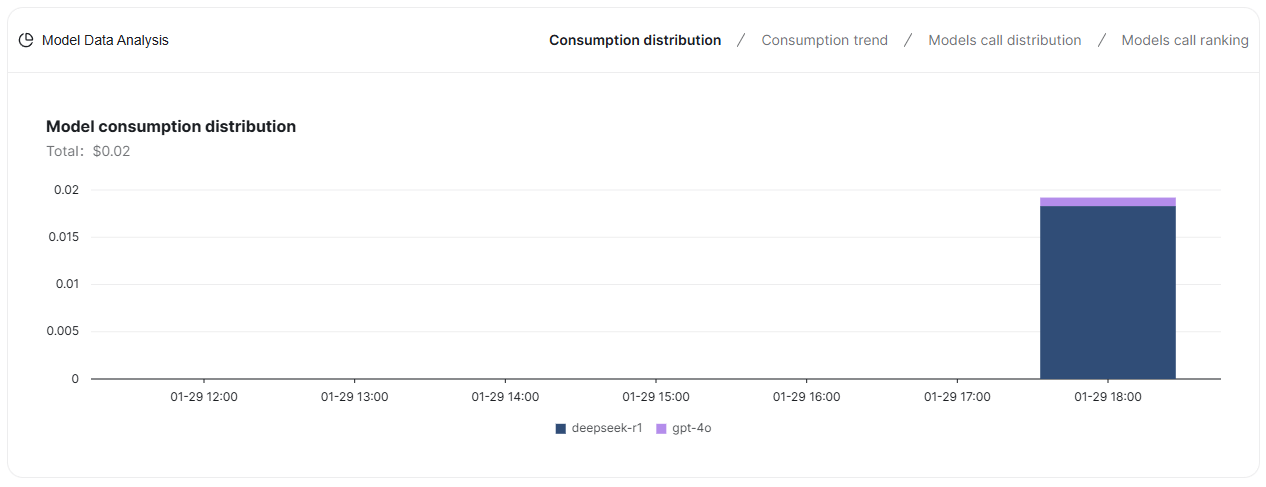
The Consumption Distribution view visualizes total usage and spend over time, grouped by model, helping you understand which models are driving cost and volume.
Additional views allow you to analyze usage trends, compare call distribution across models, and rank models by activity. These charts populate once sufficient traffic is available.
API Information
The API Information panel displays configuration details related to API access.
If this section shows No API information, it usually means no API keys have been created yet or API configuration has not been completed. API keys can be created and managed from the API Keys section in the sidebar.
System Notice
System Notice displays platform-level announcements or operational messages relevant to your workspace. If no notices are configured, this section remains empty.
Service Status
Service Status shows uptime and monitoring information for AIsa services associated with your account. If monitoring is not configured, this section will not display any data.
Updated 22 days ago